🎯 Problem Statement# Modern Kubernetes environments face observability challenges:
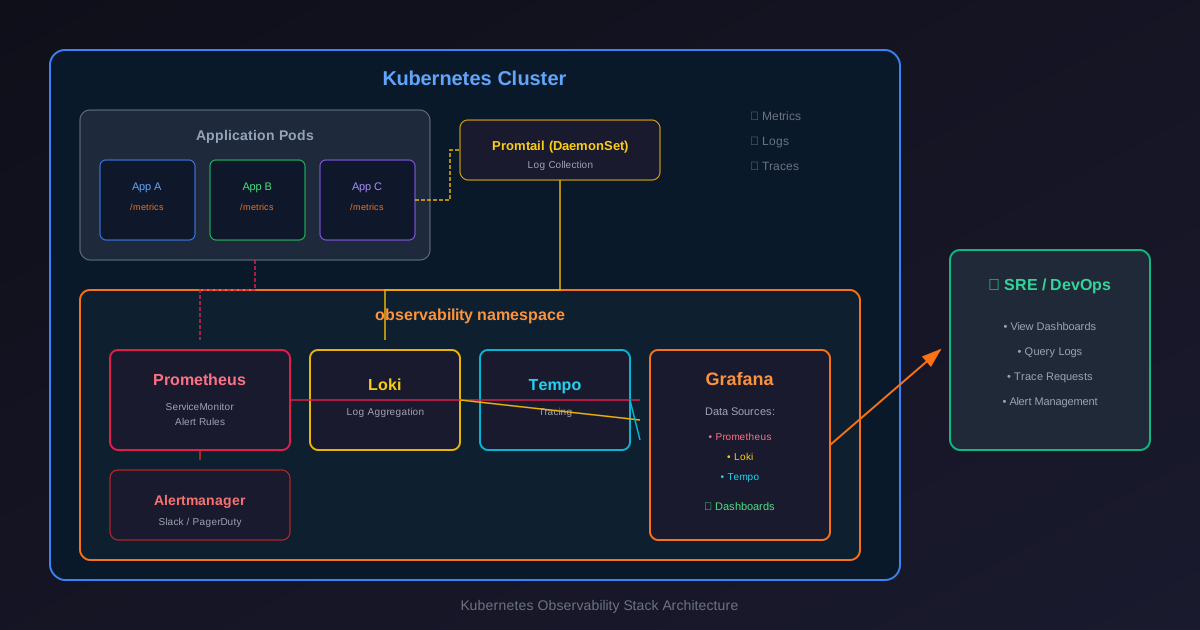
Visibility Gap - No centralized view of cluster and application healthTroubleshooting - Difficulty correlating metrics, logs, and tracesAlert Fatigue - Too many false positives or missing critical alertsCost - Expensive commercial APM solutionsScalability - Monitoring solution must scale with the cluster💡 Solution Overview# I designed and deployed a comprehensive open-source observability stack using Prometheus, Grafana, Loki, and Tempo, providing metrics, logs, traces, and alerting in a unified platform.
🏗️ Architecture# ┌ │ ├ │ │ │ │ │ │ │ │ │ │ │ │ │ │ │ │ │ │ │ │ │ │ │ │ │ │ │ │ │ │ │ │ │ │ │ │ │ │ │ │ │ │ │ │ │ │ │ │ └ ─ ─ ─ ─ ─ ─ ─ ─ ┌ │ │ │ │ │ └ ┌ │ │ │ │ │ │ │ │ │ │ │ │ │ │ │ │ │ │ │ │ │ │ │ │ │ │ │ │ │ │ │ │ │ │ │ └ ─ ─ ─ ─ ─ ─ ─ ─ ─ ─ ─ ─ ─ ─ ─ ─ ─ ─ ┌ │ │ └ ─ ─ ─ ─ ─ ─ ─ ─ ─ ─ ─ ─ ─ ─ ─ ─ ─ A / ─ ─ ─ ─ ─ ─ ─ ─ ─ p m ─ ─ ─ ┌ │ │ │ │ └ ┌ │ │ │ └ ┌ │ │ │ │ │ │ │ └ ┌ │ │ │ └ ┌ │ │ └ ─ ─ ─ ─ ─ ─ p e ─ ─ ─ ─ ─ ─ ─ ─ ─ ─ ─ ─ ─ ─ ─ ─ ─ ─ ─ t ┬ ┼ │ └ ─ ─ ─ ─ ─ ─ ─ ─ ─ ─ ─ ─ ─ ─ ─ ─ ─ A r ─ ─ ─ ─ ─ - - - ─ ─ - - ─ ─ ┌ │ │ │ │ └ ─ ─ ( ─ ─ ─ ─ ─ ─ ─ ─ ─ i ─ ─ ─ ─ ─ ─ ─ ─ ─ ─ ─ ─ ─ L ─ ─ - ─ ─ ─ ─ ─ ─ ─ c ─ ─ ─ ─ ─ S R A ─ ─ R S ─ ─ ─ D - - - ─ ─ ─ o ─ ─ ─ ─ ─ ─ ─ ─ ─ s ─ ─ ─ ─ ─ e e l ─ ─ o l ─ ─ ─ a ─ ─ ─ g ─ ─ C ─ ─ ─ ─ ─ ─ ┐ │ │ ┘ ─ ─ ─ ─ r c e ─ ─ u a ─ ─ ─ t P L T ─ ─ ─ ─ ─ o ─ ─ ─ ─ ─ ─ ─ ─ ─ ─ v o r ─ ─ t c ─ ─ ─ a r o e ─ ─ ─ L A ─ ─ l ─ ─ ─ ─ ─ ─ ┌ │ │ └ ─ ─ ─ O ─ i r t ─ ─ i k ─ ─ ─ o k m ─ ─ ─ o g ─ ─ l ─ ─ ─ ─ ─ ─ ─ ─ ─ ─ ─ b ─ c d ─ ─ n / ─ ─ ─ S m i p ─ ─ ─ k g ─ ─ e ─ ─ ─ ─ ─ ─ ─ A / ─ ─ ─ ─ s ─ e i R ─ ─ g P ─ ─ ─ o e o ─ ─ ─ i r ─ ─ P c ─ ─ ─ ─ K ─ ─ ─ p m ─ ─ ─ ─ e ─ P M n u ─ ─ A a ─ ─ ─ u t ( ─ ─ ─ e ─ ─ r t ─ ─ ─ ─ u ─ ─ ─ p e ─ ─ ─ ─ r ─ r o g l ─ ─ l g ─ ─ ─ r h L ( ─ ─ ─ g ─ ─ o s ─ ─ ─ ─ b ─ ─ ─ t ┬ ┼ │ ┴ ─ v ─ o n e ─ ─ e e ─ ─ ─ c e o T ─ ─ ─ a ─ ─ m ─ ─ ─ ─ e ─ ─ A ─ B r ─ ─ ─ ─ a ─ m i R s ─ ─ r r ─ ─ G ─ e u g r ─ ─ ─ t ─ ─ t l ─ ─ ─ ─ r ─ ─ p ─ i ─ ─ ─ ─ b ─ e t u ─ ─ t D ─ ─ r ─ s s s a ─ ─ ─ i ─ ─ a o ─ ─ ─ ─ n ─ ─ p ─ c ─ ─ ─ ─ i ─ t o l ─ ─ m u ─ ─ a ─ : ) c ─ ─ ─ o ─ ─ i g ─ ─ ─ ─ e ─ ─ l ─ s ─ ─ ─ ─ l ─ h r e ─ ─ a t ─ ─ f ─ ( e ─ ─ ─ n ─ ─ l s ─ ─ ─ ─ t ─ ─ i ┐ │ │ ┘ ─ ─ ─ i ─ e s ─ ─ n y ─ ─ a ─ M s ─ ─ ─ ) ─ ─ ─ ─ ─ ─ e ─ ─ c ─ ┬ │ ┼ t │ ▼ u C ┬ │ ▼ a ─ ─ n ─ e ) ─ ─ ┐ │ │ │ ┘ ─ ( f ─ ─ ─ ─ s ─ ─ a ┌ │ │ └ ─ ─ ─ y ─ s R ─ ─ g ─ ─ a ─ t ─ ─ ─ D r ─ ─ ─ ─ ─ ─ t ─ ─ ─ ─ ─ ─ D ─ ─ e ─ ─ ─ r ─ ─ ─ a o ─ ─ ─ ─ C ─ ─ i ─ A / ─ ─ ─ ─ N ─ s ─ ─ r ─ ─ ─ i ─ ─ ┌ │ │ │ └ ─ e m ─ ─ ─ ─ l ─ ─ o ─ p m ─ ─ ─ ─ a ─ ─ ─ ─ ─ ─ c ─ ─ ─ ─ ─ m ─ ─ ─ ─ u ─ ─ n ─ p e ─ ─ ─ ─ m ─ ─ ─ ─ ─ ─ s ─ ─ ─ ( ─ ─ o a ─ ─ ─ ─ s ─ ─ ─ t ┬ ┼ │ ┴ ─ e ─ ─ ─ ─ ─ ─ ) ─ ─ ─ D T ─ ─ n l ─ ─ ─ ─ t ─ ─ P ─ C r ─ ─ ─ ─ s ─ ─ ─ ─ ─ ─ ─ ─ ─ i r ─ ─ S l ─ ─ ─ ─ e ─ ─ o ─ i ─ ─ ─ ─ p ─ ─ ─ ─ ─ ─ ─ ─ ─ s a ─ ─ e ─ ─ ─ ─ r ─ ─ d ─ c ─ ─ ─ ─ a ─ ─ ─ ─ ─ ─ ─ ─ ─ t c ─ ─ t p ─ ─ ─ ─ ─ ─ s ─ s ─ ─ ─ ─ c ─ ─ ─ ─ ─ ─ ─ ─ ─ T r i ─ ─ ) o ─ ─ ─ ─ ─ ─ ┐ │ │ ┘ ─ ─ ─ e ─ ─ ─ ─ ─ ─ ─ ─ ─ e i n ─ ─ d ─ ─ ─ ─ ─ ─ ─ ─ ─ ─ ─ ─ ─ ─ ─ ─ ─ ─ m b g ─ ─ s ─ ─ ─ ─ ─ ─ ┌ │ │ └ ─ ─ ─ ─ ─ ─ ─ ─ ─ ─ ─ ─ p u ) ─ ─ ─ ─ ─ ─ ─ ─ ─ ─ ─ ─ ─ ─ ─ ─ ─ ─ ─ ─ ─ ─ o t ─ ─ ─ ─ ─ ─ ─ ─ ─ A / ─ ─ ─ ─ ─ ─ ─ ─ ─ ─ ─ ─ ─ e ─ ─ ─ ─ ─ ─ ─ ─ ─ p m ─ ─ ─ ─ ─ ─ ─ ─ ─ ─ ─ ─ ─ d ─ ─ ─ ─ ─ ─ ─ ─ ─ p e ─ ─ ─ ─ ─ ─ ─ ─ ─ ─ ─ ─ ─ ─ ─ ─ ─ ─ ─ ─ ─ ─ t ┬ ┼ │ ┘ ─ ─ ─ ─ ─ ─ ┐ │ │ │ ┘ ─ ─ ─ ─ ─ ─ ─ ─ ─ ─ ─ D r ─ ─ ─ ┐ │ ┘ ┐ │ │ ┘ ┐ │ │ │ │ │ │ ┘ ─ ─ ┐ │ │ ┘ ─ ─ ─ ─ ─ ─ i ─ ─ ─ │ │ │ │ │ │ ─ ─ ─ ─ ─ ─ ─ ─ c ─ ─ ─ ─ ─ ─ ─ ─ ─ ─ ─ s ─ ─ ─ ─ ─ ─ ─ ─ ─ ─ ┐ │ │ ┘ ─ ─ ┐ │ │ │ ┘ ─ ─ ─ ─ ─ ─ ─ ─ ─ ─ ─ ─ ─ ─ ─ ─ ─ ─ ─ ─ ─ ─ ─ ─ ─ ─ ─ ─ ─ ─ ─ ─ ─ ─ ─ ─ ─ ─ ─ ─ ─ ─ ─ ─ ─ ─ ─ ─ ─ ─ ─ ─ ─ ─ ─ ─ ─ ─ ─ ─ ─ │ │ │ │ ─ ─ ─ ─ ─ ─ ┐ ┘ ─ ─ ─ ─ ─ │ ┐ │ │ │ │ │ │ │ │ │ │ │ │ │ │ │ │ │ │ │ │ │ │ │ ─ ─ ─ ─ │ │ │ │ │ │ │ │ │ │ │ │ ┘ ─ ─ ─ │ │ │ │ ─ ┐ ┤ │ │ ┘ │ │ │ │ │ │ │ │ │ │ │ │ │ │ │ │ │ │ │ │ │ │ │ │ │ │ │ │ │ │ │ │ │ │ │ │ │ │ │ │ │ │ │
🛠️ Technologies Used# Component Technology Purpose Metrics Prometheus Time-series metrics collection Visualization Grafana Dashboards and alerting UI Logs Loki + Promtail Log aggregation Traces Tempo Distributed tracing Alerting Alertmanager Alert routing and notifications Deployment Helm + ArgoCD GitOps-based deployment Storage Thanos Long-term metrics storage
📁 Project Structure# k ├ │ │ │ │ │ ├ │ │ │ │ ├ │ │ │ │ ├ │ └ 8 ─ ─ ─ ─ ─ s ─ ─ ─ ─ ─ - o h └ d ├ ├ ├ └ a ├ ├ ├ └ s └ k b e ─ a ─ ─ ─ ─ l ─ ─ ─ ─ e ─ u s l ─ s ─ ─ ─ ─ e ─ ─ ─ ─ r ─ s e m h r v t r / v ├ ├ ├ └ b c p n a t n p a s i a o a ─ ─ ─ ─ o l o o p s o p l c p m a l ─ ─ ─ ─ a u d d p d d p o e p i b u r s - e l e - l - m l z i e p g l t d t m - i - a i a o i a l s r r o e s e e e c a l c l n c t i / o a k m / r t x a l e a e i a i t m f i p - r p t e r t r t t o y e a - o o i o i r t i t o i n / t n v - v c r o t s o s r o . h a a v e s t n s . n . s n y e - l a r . e - . y - y / - a u v u l v j r m y a a a m m s a e u i s . e a m l m o l - l s e e o j t m l e l n v u . s w n s r l r i a e y . . o i t t l s a y j n c s o u . m a s s . r e y l m o . y s s a l n j a . . m s m y y l o l a a n m m l l 🔧 Implementation Highlights# Prometheus ServiceMonitor# 1
2
3
4
5
6
7
8
9
10
11
12
13
14
15
16
17
18
19
20
apiVersion : monitoring.coreos.com/v1
kind : ServiceMonitor
metadata :
name : app-metrics
namespace : observability
labels :
release : prometheus
spec :
selector :
matchLabels :
app : my-application
namespaceSelector :
matchNames :
- production
- staging
endpoints :
- port : metrics
interval : 30s
path : /metrics
scrapeTimeout : 10s
Alert Rules for SLOs# 1
2
3
4
5
6
7
8
9
10
11
12
13
14
15
16
17
18
19
20
21
22
23
24
25
26
27
28
29
30
31
32
33
34
35
apiVersion : monitoring.coreos.com/v1
kind : PrometheusRule
metadata :
name : slo-alerts
namespace : observability
spec :
groups :
- name : slo.rules
rules :
- alert : HighErrorRate
expr : |
(
sum(rate(http_requests_total{status=~"5.."}[5m]))
/
sum(rate(http_requests_total[5m]))
) > 0.01
for : 5m
labels :
severity : critical
annotations :
summary : "High error rate detected"
description : "Error rate is {{ $value | humanizePercentage }} (>1% threshold)"
runbook_url : "https://runbooks.example.com/high-error-rate"
- alert : HighLatencyP99
expr : |
histogram_quantile(0.99,
sum(rate(http_request_duration_seconds_bucket[5m])) by (le, service)
) > 0.5
for : 10m
labels :
severity : warning
annotations :
summary : "P99 latency is high"
description : "P99 latency for {{ $labels.service }} is {{ $value }}s"
Grafana Dashboard as Code# 1
2
3
4
5
6
7
8
9
10
11
12
13
14
15
16
17
18
19
20
21
22
23
24
25
26
27
28
29
30
31
32
33
34
35
36
apiVersion : v1
kind : ConfigMap
metadata :
name : grafana-dashboards
namespace : observability
labels :
grafana_dashboard : "1"
data :
cluster-overview.json : |
{
"dashboard": {
"title": "Cluster Overview",
"panels": [
{
"title": "CPU Usage",
"type": "graph",
"targets": [
{
"expr": "sum(rate(container_cpu_usage_seconds_total[5m])) by (namespace)",
"legendFormat": "{{namespace}}"
}
]
},
{
"title": "Memory Usage",
"type": "graph",
"targets": [
{
"expr": "sum(container_memory_usage_bytes) by (namespace) / 1024 / 1024 / 1024",
"legendFormat": "{{namespace}} (GB)"
}
]
}
]
}
}
Loki Log Queries# 1
2
3
4
5
6
7
8
# Error logs from production namespace
{namespace="production"} |= "error" | json | line_format "{{.message}}"

# Slow requests (>1s response time)
{app="api-gateway"} | json | response_time > 1000

# Failed Kubernetes events
{job="kubernetes-events"} | json | type="Warning"
📊 Dashboards Created# Dashboard Purpose Cluster Overview Node health, resource utilization, pod status Namespace Metrics Per-namespace resource consumption Application SLOs Error rates, latency percentiles, throughput Node Exporter Detailed node-level metrics Kubernetes Events Cluster events and warnings Cost Analysis Resource costs by namespace/team
🔔 Alerting Strategy# Alert Severity Levels# Severity Response Time Notification Channel Critical Immediate PagerDuty + Slack Warning 1 hour Slack Info Next business day Email
SLO-Based Alerting# Availability SLO : 99.9% uptimeLatency SLO : P99 < 500msError Budget : Alert when 50% consumed in 24h📈 Results & Metrics# Metric Achievement MTTR Reduced from 2 hours to 15 minutes Alert Noise Reduced false positives by 80% Cost Savings $50k/year vs commercial APM Log Retention 30 days with 99.9% query performance Dashboard Load < 3 seconds for complex queries
🔑 Key Learnings# Start with SLOs - Define SLOs first, then build alerts around themReduce Cardinality - High cardinality labels kill Prometheus performanceRetention Tiers - Different retention for different metric typesRunbooks - Every alert should link to a runbookOn-Call Experience - Invest in alert routing and escalation🔗 Resources# Need help with observability? Contact me !